What are Reporting Resources?
By E.J. Graff
A Republican push to redraw congressional electoral district maps and pick up more House seats has set off a chain reaction, triggering a controversial, bipartisan wave of mid-decade redistricting across the U.S.
This wave is being driven by two main factors: One, the U.S. Supreme Court has issued a series of rulings that make it much harder to challenge partisan redistricting efforts, and court rulings have also narrowed protections for minority voter representation. Two, President Trump has called on several Republican-led states to break the usual once-a-decade redistricting cycle in advance of the 2026 midterm elections, and some Democratic-led states have moved to counter those efforts with new maps of their own.
Local journalists covering elections in several states this year face a reshaped electoral landscape. And throughout the U.S., reporters will cover the possibility of further redistricting ahead of voting in 2028.
Independent, nonpartisan research can help journalists understand how redistricting works, scientific methods for determining fairness, the historical impact of redistricting tactics, and, notably, the role of partisan legislatures in the process.
Some states use independent commissions to make redistricting decisions. But in most states, elected state legislators are responsible for drawing the lines for both state and congressional voting districts.
Because the party that wins control of the state legislature may have the power to redraw the district maps—at any time—in a way that tilts future elections in its favor, state legislative elections in 2026 are “just going to be massively important,” says Christopher Warshaw, a public policy professor at Georgetown University who studies American politics and specializes in election law.
This reporting guide will help you understand how we got here; why and how redistricting happens; what gerrymandering is, how it works, and why it’s allowed; how political scientists measure gerrymandering; what research says about its impact; and your state’s particular redistricting process. Plus, you’ll get some great story ideas and reporting tips, guided by researchers who have studied the topic for decades.
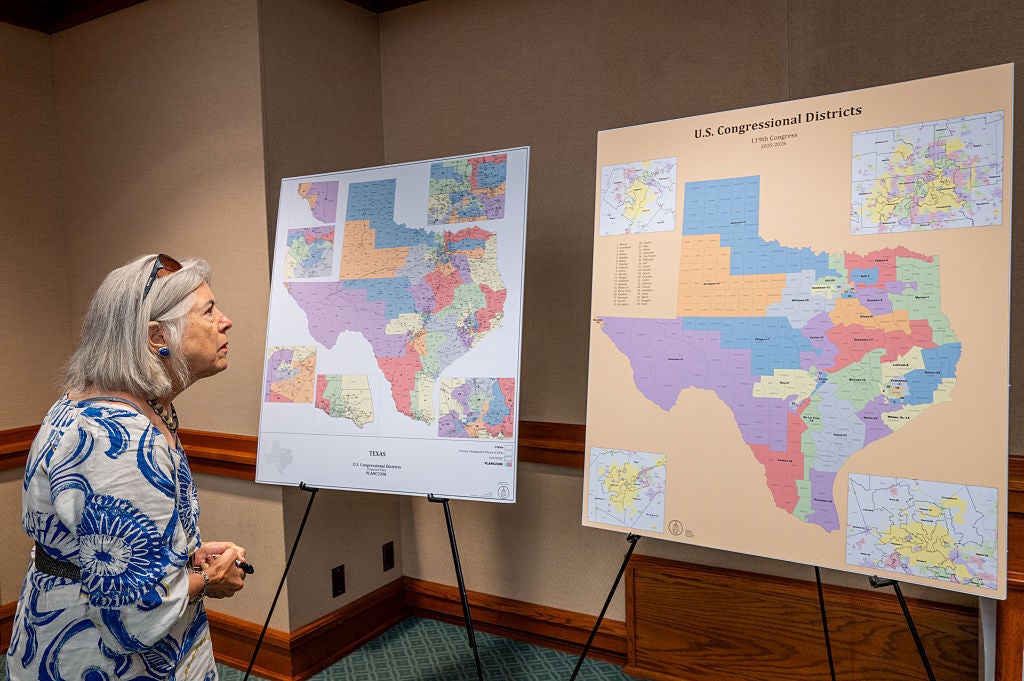
In July 2025, President Donald Trump asked the Republican Texas governor and Republican-dominated state legislature to redraw congressional district lines to help elect more Republicans to Congress. They did.
Many other states have since done or considered doing the same—either to help national Republicans retain control of the U.S. House of Representatives, or to counter Texas’s move by boosting Democrats’ prospects.
For example, in California, which has had an independent redistricting commission since 2010, the Democratic governor and Democratic-dominated legislature asked voters to pass an initiative that temporarily gave legislators the power to draw a redistricting map that favored Democrats, to counter Texas’s gerrymandering. The proposition passed Nov. 4, 2025, and that new map is in place for this November’s midterm elections.
Since the summer of 2025, nine states have redrawn their congressional maps by legislation or referendum: Alabama, California, Florida, Louisiana, Missouri, North Carolina, Ohio, Tennessee, and Texas. In addition, Utah’s map was changed to comply with a court order. Most of these states are controlled by Republicans who were aiming to make maps less favorable to Democratic candidates.
During the same timeframe, redistricting efforts failed due to political conditions or court challenges in Republican-controlled states including Georgia, Indiana, and South Carolina, and Democratic-controlled states Maryland and Virginia.
In some cases, legislative efforts, litigation, or referendums are underway to change these outcomes, if not for 2026 then for 2028. The National Conference of State Legislatures has an extremely useful tracker that shows which states have attempted mid-decade redistricting this cycle, and where those efforts stand at any particular moment.
Two major court cases in 1964 established a standard that led to most states redrawing their maps once every decade.
In the landmark case Wesberry v. Sanders, the Supreme Court ruled that each congressional House district must include roughly the same population as any other district in that state, to ensure that each citizen’s vote has equal weight.
In a separate case, Reynolds v. Sims, the court issued a similar ruling regarding each state legislative district.
Since then, states have typically redrawn districts every ten years, after the U.S. census determines each state and county’s current population and, therefore, how many members of Congress are allocated to each state.
Sometimes a state or federal judge will order new districts drawn because an existing district map violates a state or federal legal or constitutional principle, but it’s generally up to an official state body to decide when and how to redraw the geographic boundaries of the voting districts.
States can also decide to redraw their lines in the middle of the decade, as federal law does not disallow that. Until recently, though, that practice has been rare in this century. Before the current redistricting wave, only two states had redrawn their maps mid-decade to benefit a particular party since 1970: Texas in 2003 and Georgia in 2005, according to an analysis by Pew Research Center.
In fact, not only do most state legislatures draw district lines for federal elections, but also for their own state legislative seats. Political scientist Barry Burden, director of the Elections Research Center at the University of Wisconsin-Madison, explained, “The U.S. is essentially the only country in the world that lets partisan politicians draw district lines” for their own seats, in effect selecting their own voters.
Each state draws its own districts; chooses its own method for drawing districts; and sets its own constitutional, legislative and legal requirements about how to pass, review, approve, override and judge a district map. These can differ greatly from one state to the next.
The longtime, frequently criticized and court-challenged practice of redrawing districts specifically to give an advantage to a particular political party, politician, or group of voters is commonly referred to as gerrymandering. The term comes from a political cartoon mocking an 1812 Massachusetts map designed to help one party, signed into law by then-Gov. Elbridge Gerry, which included an oddly shaped district one observer thought looked like a salamander.
District lines can be redrawn in various ways to strengthen or dilute the other party’s voting power. The independent, nonpartisan Institute for Mathematics and Democracy at Wellesley College offers helpful graphics to explain various gerrymandering methods, which include:
While gerrymandering has been undertaken for much of this nation’s history, it was partly constrained when Congress passed the Voting Rights Act of 1965, landmark legislation that aimed to enable Black people to vote in jurisdictions where they had been violently prevented from doing so for nearly a century after the 1870 ratification of the 15th Amendment, which prohibited denying people the right to vote based on their race.
In recent decades, the Supreme Court has issued a series of rulings that make it much more difficult to challenge gerrymandering in federal courts, whether related to race or not.
When Congress reauthorized the Voting Rights Act in 1982, it explicitly outlawed any election procedures that resulted in reducing any racial group’s ability “to elect representatives of their choice,” regardless of whether that was what legislators intended.
For four decades, federal courts, including the Supreme Court, interpreted this to mean that, in certain circumstances, states must draw majority-minority districts so that Black voters made up enough of the electorate to have the opportunity to elect representatives of their choice—and not have the power of their choice “diluted” by being scattered across multiple districts. The Voting Rights Act, in other words, required legislators to consider race in drawing districts.
However, in previous cases, the Supreme Court also had determined that race could not be the predominant criterion considered when redrawing a district map, which created a legal tension that played a role in Louisiana v. Callais.
In 2024, Louisiana drew a second majority-Black congressional district (the first had existed since the 1970s) after a lower court ruled that its previous map likely violated the Voting Rights Act. In Louisiana v. Callais, the Supreme Court reversed the lower court’s interpretation, declaring that when Louisiana had drawn a new district to ensure Black voters dominated in two districts, the map was “an unconstitutional racial gerrymander.”
This was a decision that benefited Republicans. Annual polling by Pew Research Center confirms that Black voters predominantly vote for Democrats. As a result, majority-Black districts had effectively been reliable districts for Democratic political candidates. After the Supreme Court decision in Louisiana v. Callais, several Southern states moved to dismantle majority-Black districts—and thereby made it more likely that those districts would send Republicans to Congress.
Between 1986 and 2019, in several cases leading up to the Rucho v. Common Cause decision, various Supreme Court justices suggested that the Court might be willing to declare partisan gerrymandering to be unconstitutional, if there were some way that unfair partisan gerrymandering could be measured.
Several statistically sophisticated methods were proposed by scientists. The “efficiency gap” is one of the most widely used and studied. Notably, the Associated Press has used this measure to analyze partisan advantage in past congressional elections.
Developed by political scientist Eric McGhee and legal scholar Nicholas Stephanopoulos, the efficiency gap relies on the concept of “wasted votes,” in which any vote that does not contribute to a victory is considered “wasted.”
A vote is “wasted” in one of two ways: Either it’s cast for a losing candidate, or it’s cast for a winning candidate beyond the 50%-plus-one-vote threshold needed to secure that win, since in neither case did the vote contribute to a candidate’s win.
In a useful 2018 article in the Washington Post, political scientist Barry Burden, explains the concept in plain language: “The ‘efficiency gap’ captures whether a redistricting plan is potentially biased against a party by making that party waste more votes than the other.”
McGhee, now a senior fellow at the Public Policy Institute of California and author or co-author of some of the most-cited articles and measures of redistricting, explains that redistricting research has long focused on how to measure and define “fair” districts. By “fair,” he means districts in which different kinds of voters (not just by political party, but by various demographic measures such as income level, occupation, ethnic background, and so on) have a chance to elect a political representative who shares their views.
In a widely cited and thorough 2020 review of political science research on partisan gerrymandering spanning more than 30 years, McGhee notes that for more than 30 years, a great deal of political science research investigated the question, “How do we define a partisan gerrymander in a way that is fair, clear, fits within the dictates of existing laws, and avoids upending too many redistricting plans across the country?”
But in its series of decisions since 2019, “the Supreme Court has put all that to one side,” McGhee says. While individual states may have laws and court decisions about redistricting, “there are no constraints” from federal law, he says.
Writing in the Washington Post in March 2025—a few months before President Trump urged Texas to redraw its maps—Stephanopoulos, McGhee, and Warshaw reported that while efficiency gap measurements revealed a Republican skew throughout the 2000s and 2010s, the House on average showed no overall partisan lean in either direction in 2022 and 2024.
“The evaporation of the House’s bias is a milestone, but it may be short-lived,” they wrote. “Some states could redraw their districts in the middle of the decade.”
According to a data analysis by Nate Cohn, the New York Times’ chief political analyst, as of May 2026, Republicans had since tilted the field enough that, “Currently, Republicans’ advantage from redistricting would allow them to lose the popular vote by 2.5 percentage points and still win control of the House.”
While the Supreme Court may have concluded that statistical measures like the efficiency gap aren’t sufficient to set a federal legal standard, scientific research can still help journalists understand and evaluate redistricting fights at the state level, where redistricting actually happens.
For example, using the efficiency gap measurement method, political scientists Devin Caughey and Christopher Warshaw have demonstrated the impact of gerrymandering with detailed statistical evidence.
They cite Wisconsin’s redistricting history as an example in their 2022 book Dynamic Democracy: Public Opinion, Elections, and Policymaking in the American States.
When Republicans captured the state government in 2010, they went on to redraw district lines in a way that increased their electoral advantage, according to the efficiency gap. At the same time, the Legislature passed laws restricting abortion access and declined to expand Medicaid benefits under the Affordable Care Act despite widespread public support for the expansion.
“The backlash against these policies helped Democrats make political gains,” they write, “but they were unable to break through the Republican gerrymander of 2011-2012, which nearly doubled the GOP’s advantage in wasted votes. In short, gerrymandering not only enabled Republicans to pass unpopular policies but also derailed the negative electoral feedback that militates against large and unpopular policy changes.”
Redistricting commissions draw both state and federal districts in several states, including Alaska, Arizona, California, Colorado, Idaho, Michigan, Montana, New Jersey, New York, Virginia, and Washington. NCSL offers a chart that shows when and how each state with such a commission adopted it, whether by constitutional amendment, legislative decision, voter initiative, or some combination thereof.
Research can help journalists understand whether maps drawn by commissions lead to different outcomes from those made by state legislatures.
For instance, in “Do Redistricting Commissions Avoid Partisan Gerrymanders?,” published in “American Politics Research” in 2021, Robin Best and her co-authors show that putting commissions in charge of redistricting won’t necessarily eliminate partisan maps. The researchers examine the district maps produced by seven redistricting commissions in the 2010 redistricting cycle. They conclude that “three of seven commissions produced suspect results that redounded to the benefit of one party or the other: pro-Democrat in Arizona; pro-Republican in New Jersey and Virginia.”
Political scientist Matthew Nelson’s 2023 paper “Independent Redistricting Commissions Are Associated with More Competitive Elections,” published in PS: Political Science & Politics, compares election results in states where legislatures draw district lines vs. states that use independent commissions. Using data from 1982 to 2018, he finds that “independent commissions are 2.25 times more likely to have competitive elections, and they decrease incumbent party wins by 52%.”
Researchers also have studied public attitudes toward independent commissions. In “Ends versus Means: Public Opinion on Congressional Redistricting,” published in the Election Law Journal in 2024, the authors find that among those people who knew what method their state used for redistricting, satisfaction was higher in states that used independent commissions.
However, in a new working paper “The Nature and Consequences of Public Views about Election Administration in their States,” currently under review at an academic journal, Burden, Jacqueline Qiu, and Caroline Tolbert find that those opinions differ by political point of view. They write, “Among the ‘very liberal,’ nearly 80% prefer a nonpartisan or bipartisan board to handle redistricting, but among the ‘very conservative,’ just a bare majority hold this view, and one-third would prefer a more partisan process under the control of the state legislature.”
That said, as the authors write, “the public is substantially unaware of how the controversial matters of election administration and redistricting are actually handled in their states.”
Given the widespread lack of information on redistricting, simply explaining your state’s redistricting process and rules might be a useful service article.
With that in mind ….
For journalists covering the midterm elections, it’s important to know the particulars of their state’s redistricting process to keep track of whether standards and laws are being followed. You can learn more about each state’s rules at All About Redistricting, a detailed and readable examination of the topic by Justin Levitt, a Loyola Law School professor and elections expert. The American Redistricting Project gives useful charts with a history of what body in each state has drawn districts from 1961 forward.
Here are a few important things to know:
Below, the criteria definitions are quoted directly from the National Conference of State Legislators’ “Redistricting Criteria” page. The numbers given are for states that require these for congressional districts; redistricting requirements may differ for drawing state legislative districts. Some common requirements include:
Burden notes that in many cases, these common requirements and expectations conflict with one another. For instance, a mapmaker may aim to draw a map that brings together various farming communities, to give them a voice in the state legislature—but doing so would involve crossing two counties and result in a long, string-bean shaped district instead of a nice compact blob.
Here are a few redistricting reporting tips and story ideas for local journalists, guided by insights from the researchers interviewed for this piece.
In a post on his “All about Redistricting” site, Levitt writes, “Counting people at their last known address before incarceration — where virtually all people return when they are released from prison — accounts for representation of whole communities without undue distortion.”
The NCSL has a table detailing how 15 states have reallocated prison populations to the districts where they had lived before incarceration, under which law and in what year. This 2019 Stateline article examines the issues and effects of this population redistribution.
About the author: E.J. Graff is an award-winning journalist, author, and editor whose work has appeared in such publications as The New York Times Magazine, Foreign Policy, Mother Jones, The Nation, Newsweek, and Politico. For nine years, she was managing editor of The Monkey Cage, a political science column at The Washington Post. She offers editorial coaching and consulting to academics in the social sciences, and publishes the newsletter “How to be American”.
This is a list of experts interviewed for this reporting guide and why they were chosen.
Political scientist Eric McGhee is one of the most-cited experts on redistricting. McGhee has published in all the major political science journals, created the most widely used measure of gerrymandering in political science, and regularly testifies about or submits amicus briefs on redistricting and other election processes.
Christopher Warshaw is considered one of the leading experts on redistricting and on how well elections and policy outcomes reflect the preferences of ordinary citizens; his work is widely cited and he regularly receives high-profile fellowships or grants; he has written about these subjects in plain language in such outlets as The New York Times and The Washington Post; and he testifies before commissions and courts on the topic.
Justin Levitt teaches constitutional law and the law of democracy; his online guide to redistricting is clear, informative, detailed, easy to understand, and widely cited by public policy institutes; he served as the White House’s first Senior Policy Advisor for Democracy and Voting Rights from 2021 to 2022; and he testifies before Congress, state legislatures, and federal and state courts.
Barry Burden is a widely cited expert on redistricting and related subjects who has published in all the major political science journals; at the University of Wisconsin-Madison, he is director of the Elections Research Center and is the Lyons Family Chair in Electoral Politics; he has written clear and informative articles in newspapers and on nonprofit sites, like The Washington Post and the Brookings Institution blog.